
The pain
Running thenping.me, on any given day I will be checking over the Vapor metrics at least three times a day:
- Once first thing in the morning, looking at the preceding 12 hours while I slept
- Once at lunch time, looking at the preceding 3 hours
- Once at the end of the day, again, at the precending 3 hours
The trouble with this is that my browser window looks a lot like this:

Add to that, that clicking into each one of these tabs then involves clicking around to locate the thing I want to look at, finding the metrics tab, and clicking to set the relevant time period (3 or 12 hours). Swap to the next tab, rinse and repeat.
Not to mention that the AWS console is built in such a way that each service is discrete, so some of them offer automatic refresh (Lambda metrics) and some of them don't (RDS).
When I want to quickly eyeball the data, clicking through tabs and pages is tedious and takes longer than I would like. And don't even get me started on the disaster that is an expired session.
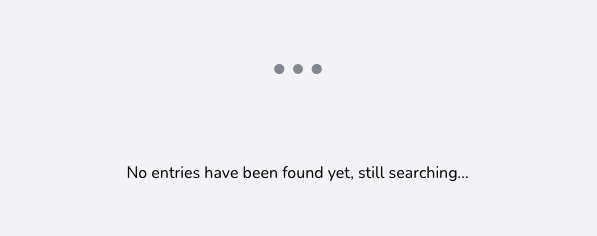
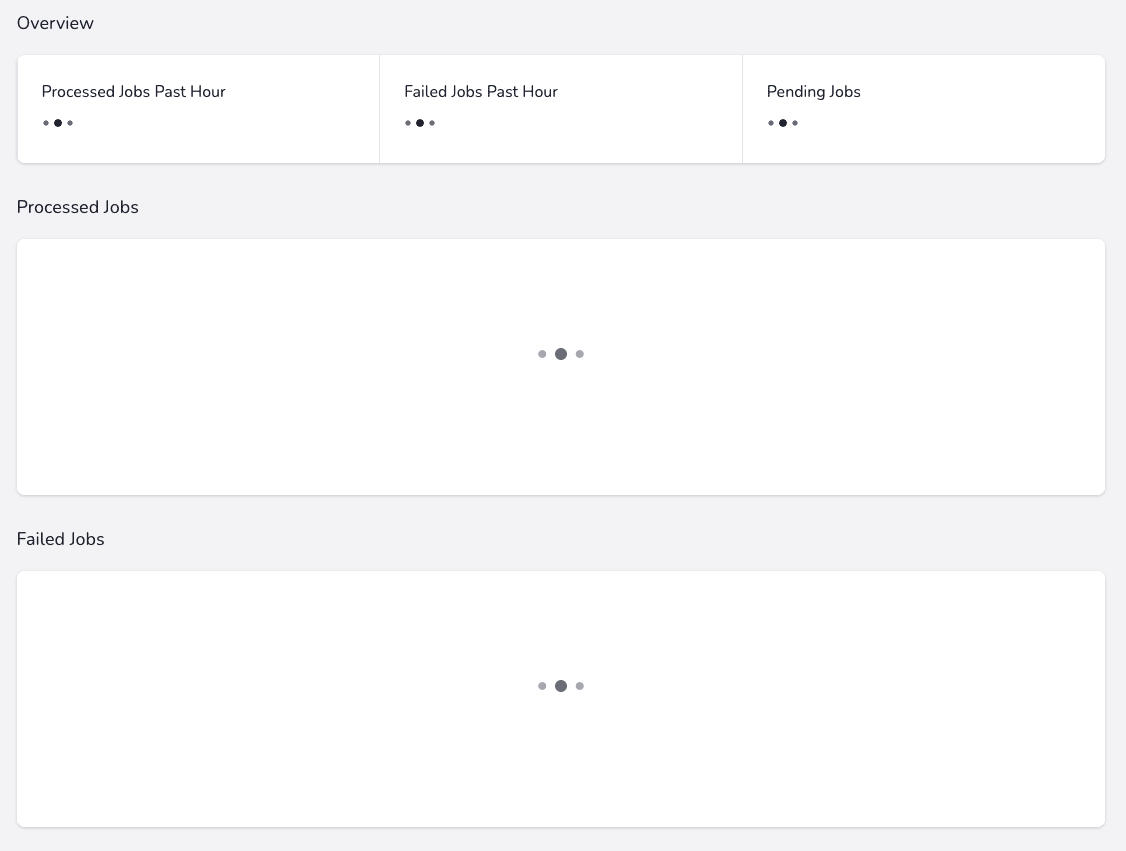
Sure, there's vapor-ui, but in my case this is what I end up seeing more often than not.

Grafana
I don't know about you, dear reader, but I've never successfully been able to get Grafana up and running. What's worse, Grafana is only the tool used to visualise your metrics. You still need configure some data source to put the data before you can even start visualising it.
Even with ready-made Docker containers I've tried and failed at this over and over.
Don't let that put you off, Grafana Cloud makes this a piece of cake!
The best part is, given the way we're going to be visualising our Vapor metrics, you'll be able to use the free tier no problem, because we're not actually pushing any metric data in to a Grafana data source.
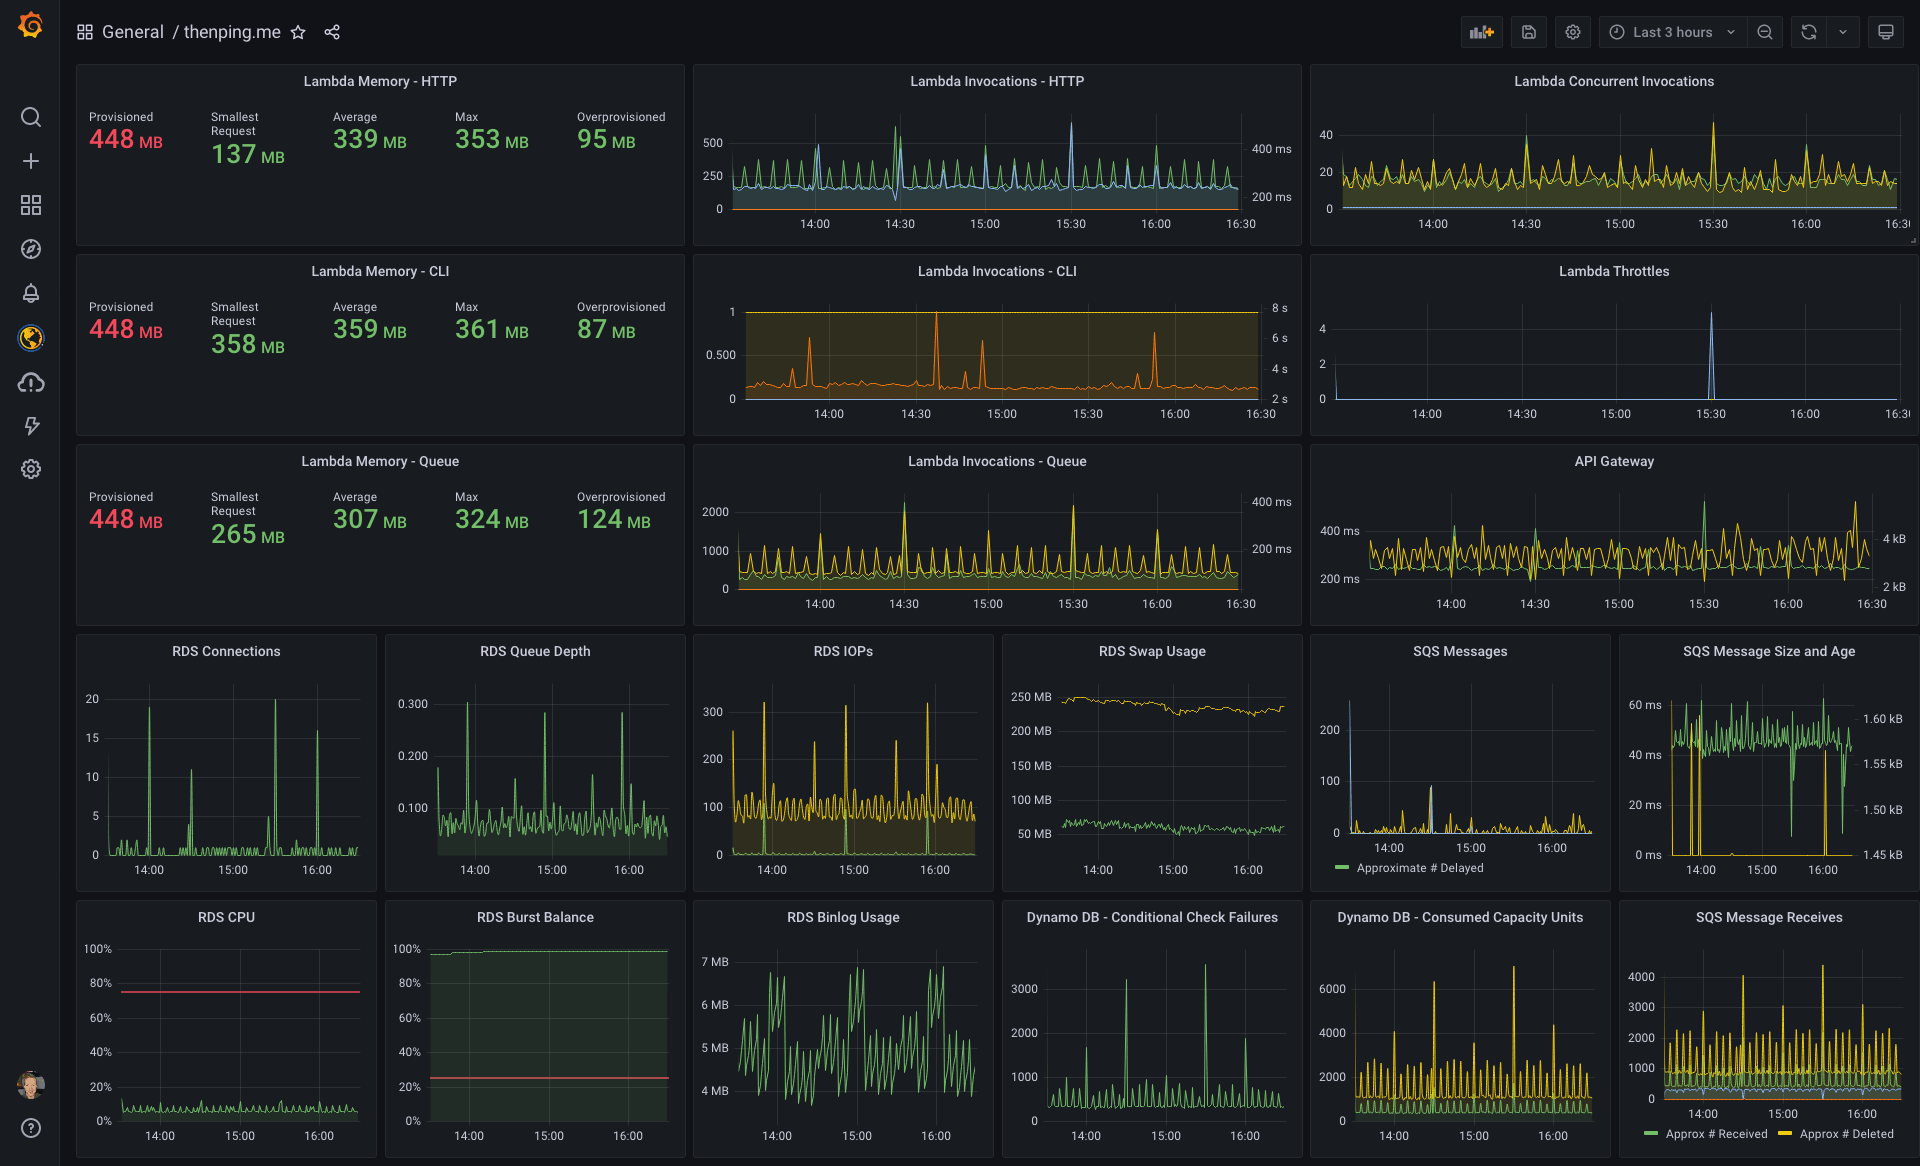
Once configured, I now see all of the Vapor metrics I need to ensure the app is healthy on one (ultrawide) screen. No more clicking around back and forth, refreshing, logging in, or remembering where I'm at.
This reduces my perusal time to seconds, as for the most part I'm eyeballing to ensure that the graphs are mostly in a straight line with little variance that would indicate some change in behaviour, an application error, or sudden influx of traffic.
Grafana Cloud considerations
First thing's first - we need to set up a free Grafana Cloud account.
The free forever access grants you:
- 3 users
- 10,000 active series for metrics
- 50 GB of logs
- 50 GB of traces
- 14-day retention
As mentioned earlier, given that we'll only be pulling our data from CloudWatch directly, rather than pushing it in to Graphite/MySQL/Postgres/Influx/whatever, we only really need to worry about two things:
- Number of users we want accessing the dashboard(s)
- Cost to extract CloudWatch data from AWS.
On point number two, as we're doing a manual fetch of metric data whenever we view the dashboard, this should not be cause for concern as the costs will be negligible, but worth noting regardless.
Set up Grafana Cloud
Once you have created your free account you'll be taken to your cloud portal, which presents you with several options from the Grafana Cloud Stack.
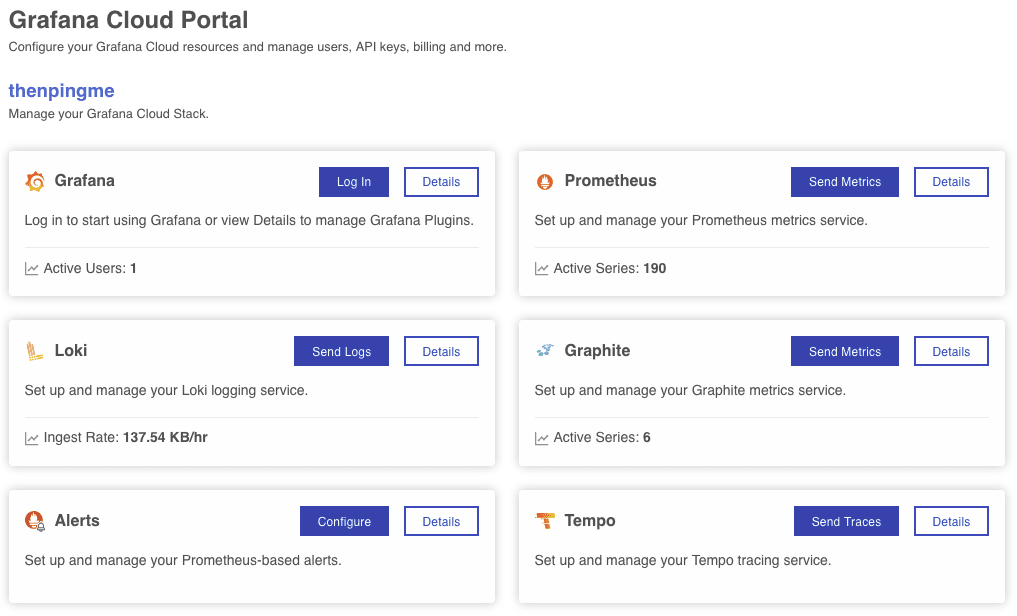
Click Log In from the Grafana card and you'll be dropped into your Grafana Cloud instance.
The fastest way to get started is to Use integrations to get started then click I'd like to just connect to an existing data source.
Select CloudWatch, which will bring you to the screen to configure your CloudWatch credentials.
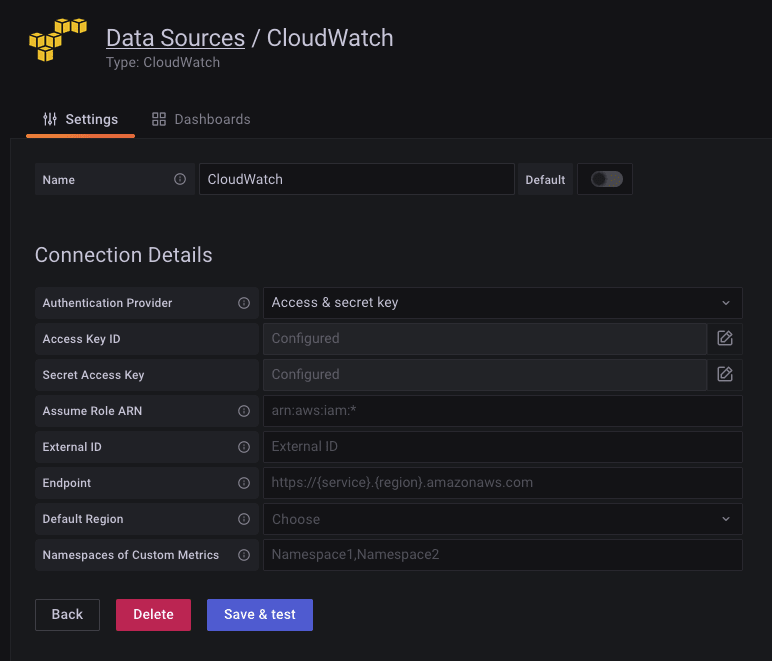
Now the fun bit; configuring an IAM in AWS Console. Ensure you are in the same region as your Vapor instance.
Fortunately for you and I, the Grafana team provides documentation and a sample policy you can use for this bit.
You'll want to create a new user with programmatic access, select Attach existing policies directly then click Create policy. Paste the JSON from below into the JSON tab, add or skip tags as you see fit, then name the policy - something groundbreaking like 'Grafana' is probably fine - then click Create policy.
Jump back to the add user page, search for your new policy, add or skip tags as you see fit, review then click Create user.
At the end of all of that, you'll get your Access Key ID and Secret Access Key, which you can copy and paste into the CloudWatch data source configuration back in Grafana. I didn't need to fill out any of the other settings, bar the default region (us-west-1 in my case). Click Save & Test but note that this resulted in an error for me, despite working anyway.
The Grafana docs include a minimal policy which, to date, has been sufficient for all my monitoring needs. It's included at the end of this post for posterity.
Visualising the metrics
Now that we've configured our CloudWatch data source, it's time to visualise the data that it makes available to us.
Hover over the + icon in the left nav, then click on Dashboard, then Add an empty panel.
Now dashboards will vary from person to person and you should visualise what it is that you need to be able to see. Remember also that the free plan includes 10 dashboards, so be mindful of how much you're visualising.
From the Data source dropdown, select CloudWatch and you'll be given your first query builder.
The Query Mode should be CloudWatch Metrics, region will default to whatever you configured in your data source (us-west-1 for me) otherwise specify a region, then choose the namespace (service) and metric you wish to visualise.
For this example, we'll first query for the average read IOPS for my RDS instance identified as thenpingme, then clone the query and modify it to visualise the write IOPS. When you've got it setup, it should look something like the following.
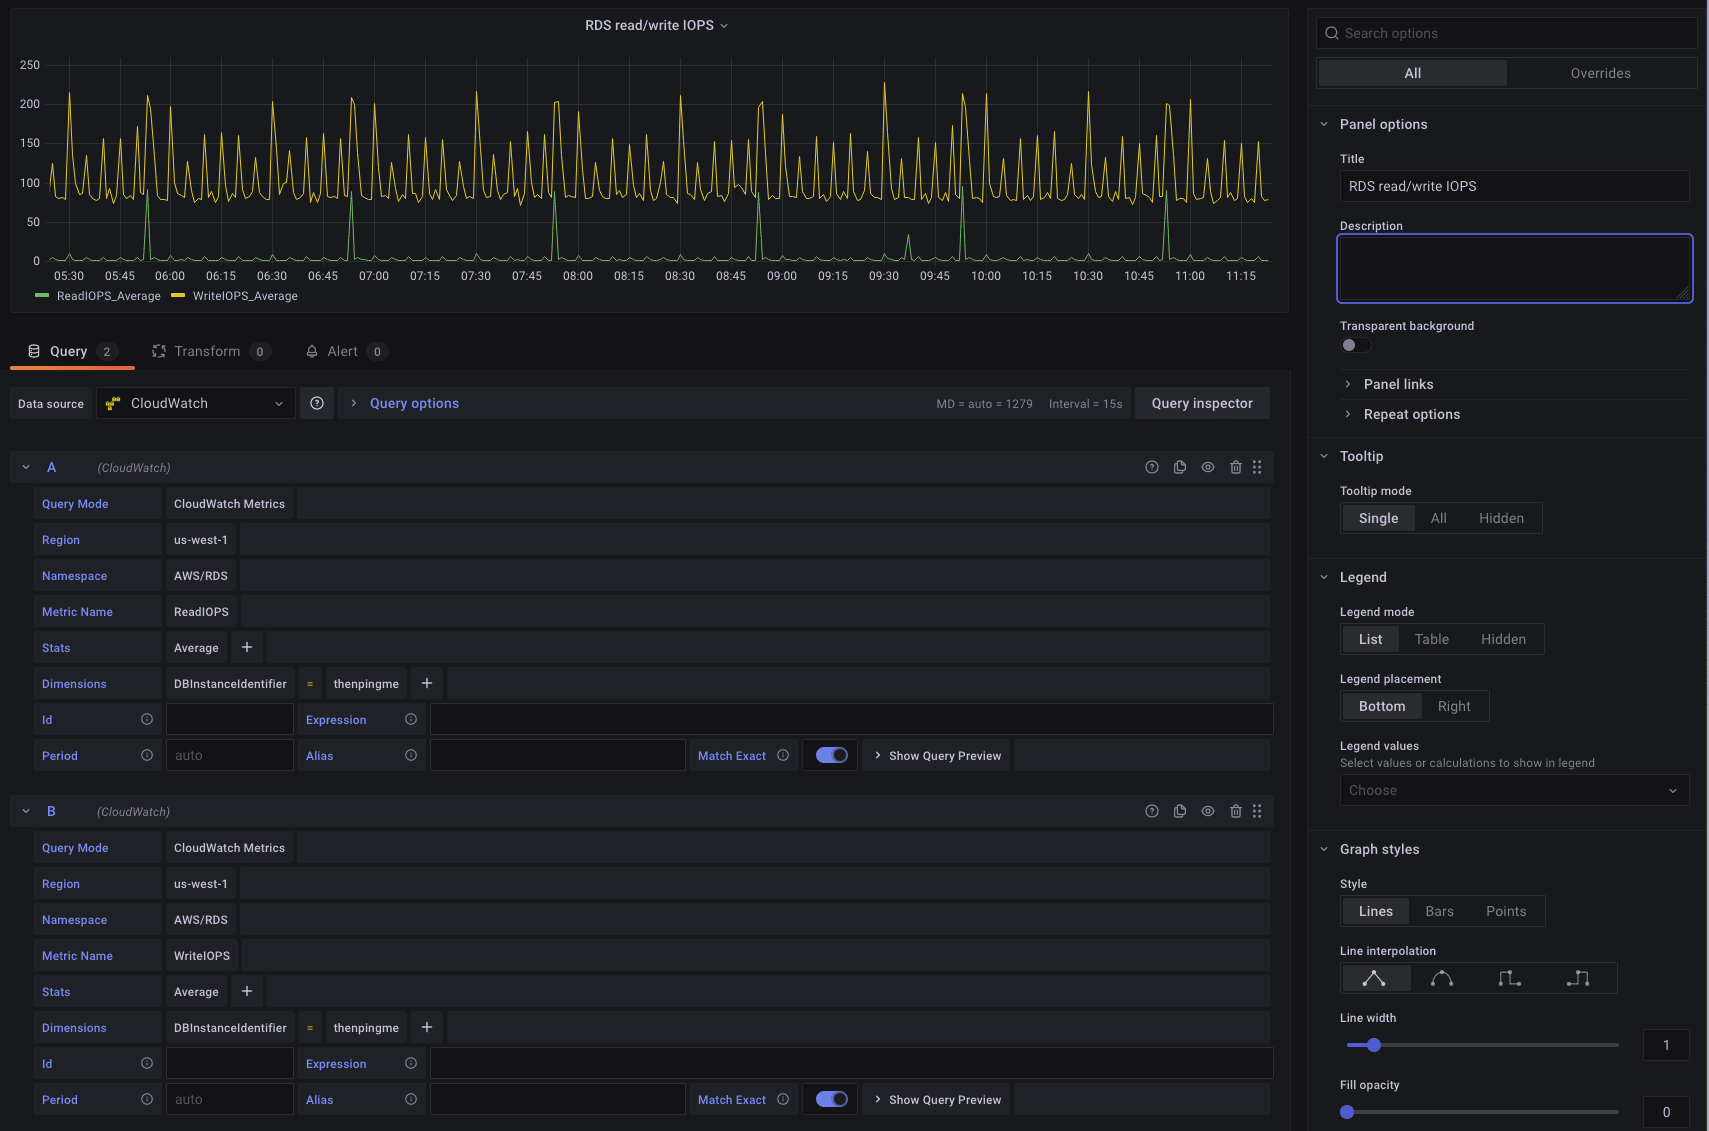
Once you're happy with your visualisation, click Apply, then Save and you've finished visualising your first CloudWatch metric!
Conclusion
The rest of this process is repetitive; add panel, set up metric query parameters, save and repeat.
I'll leave it to you to put the rest of your dashboard together, visualising the metrics that matter most to you. In my case - and I'd hazard most instances - this will be RDS IOPS, memory, CPU, and concurrent connections.
It is also useful to visualise SQS messagees so you can keep tabs on how many jobs are being queued, as well as Lambda invocations (queue and HTTP are probably more common, depending on how much you're running scheduled tasks).
Having a dashboard like this is incredibly useful:
- it allows you to see your application health at a high level instantly,
- you can review historical data quickly,
- watch for any trends to allow you to scale when you have to, and
- detect any resolve any errors early
I find that having the dashboard open in a tab in my browser is particularly useful, and makes it very simple to flick in and out every few hours to keep an eye on things throughout the course of the day.
Let me know if you spin up your own dashboard and if it helped you identify any issues within your applications, either retrospectively or as an early warning!
Appendix
In case you've forgotten by now, this is here for posterity as mentioned earlier in the post.
{
    "Version": "2012-10-17",
    "Statement": [
        {
            "Sid": "AllowReadingMetricsFromCloudWatch",
            "Effect": "Allow",
            "Action": [
                "cloudwatch:DescribeAlarmsForMetric",
                "cloudwatch:DescribeAlarmHistory",
                "cloudwatch:DescribeAlarms",
                "cloudwatch:ListMetrics",
                "cloudwatch:GetMetricStatistics",
                "cloudwatch:GetMetricData"
            ],
            "Resource": "*"
        },
        {
            "Sid": "AllowReadingLogsFromCloudWatch",
            "Effect": "Allow",
            "Action": [
                "logs:DescribeLogGroups",
                "logs:GetLogGroupFields",
                "logs:StartQuery",
                "logs:StopQuery",
                "logs:GetQueryResults",
                "logs:GetLogEvents"
            ],
            "Resource": "*"
        },
        {
            "Sid": "AllowReadingTagsInstancesRegionsFromEC2",
            "Effect": "Allow",
            "Action": [
                "ec2:DescribeTags",
                "ec2:DescribeInstances",
                "ec2:DescribeRegions"
            ],
            "Resource": "*"
        },
        {
            "Sid": "AllowReadingResourcesForTags",
            "Effect": "Allow",
            "Action": "tag:GetResources",
            "Resource": "*"
        }
    ]
}